Research, Strategy, & Design Opened Equinix's Market: Data Center Network Port Web Orders
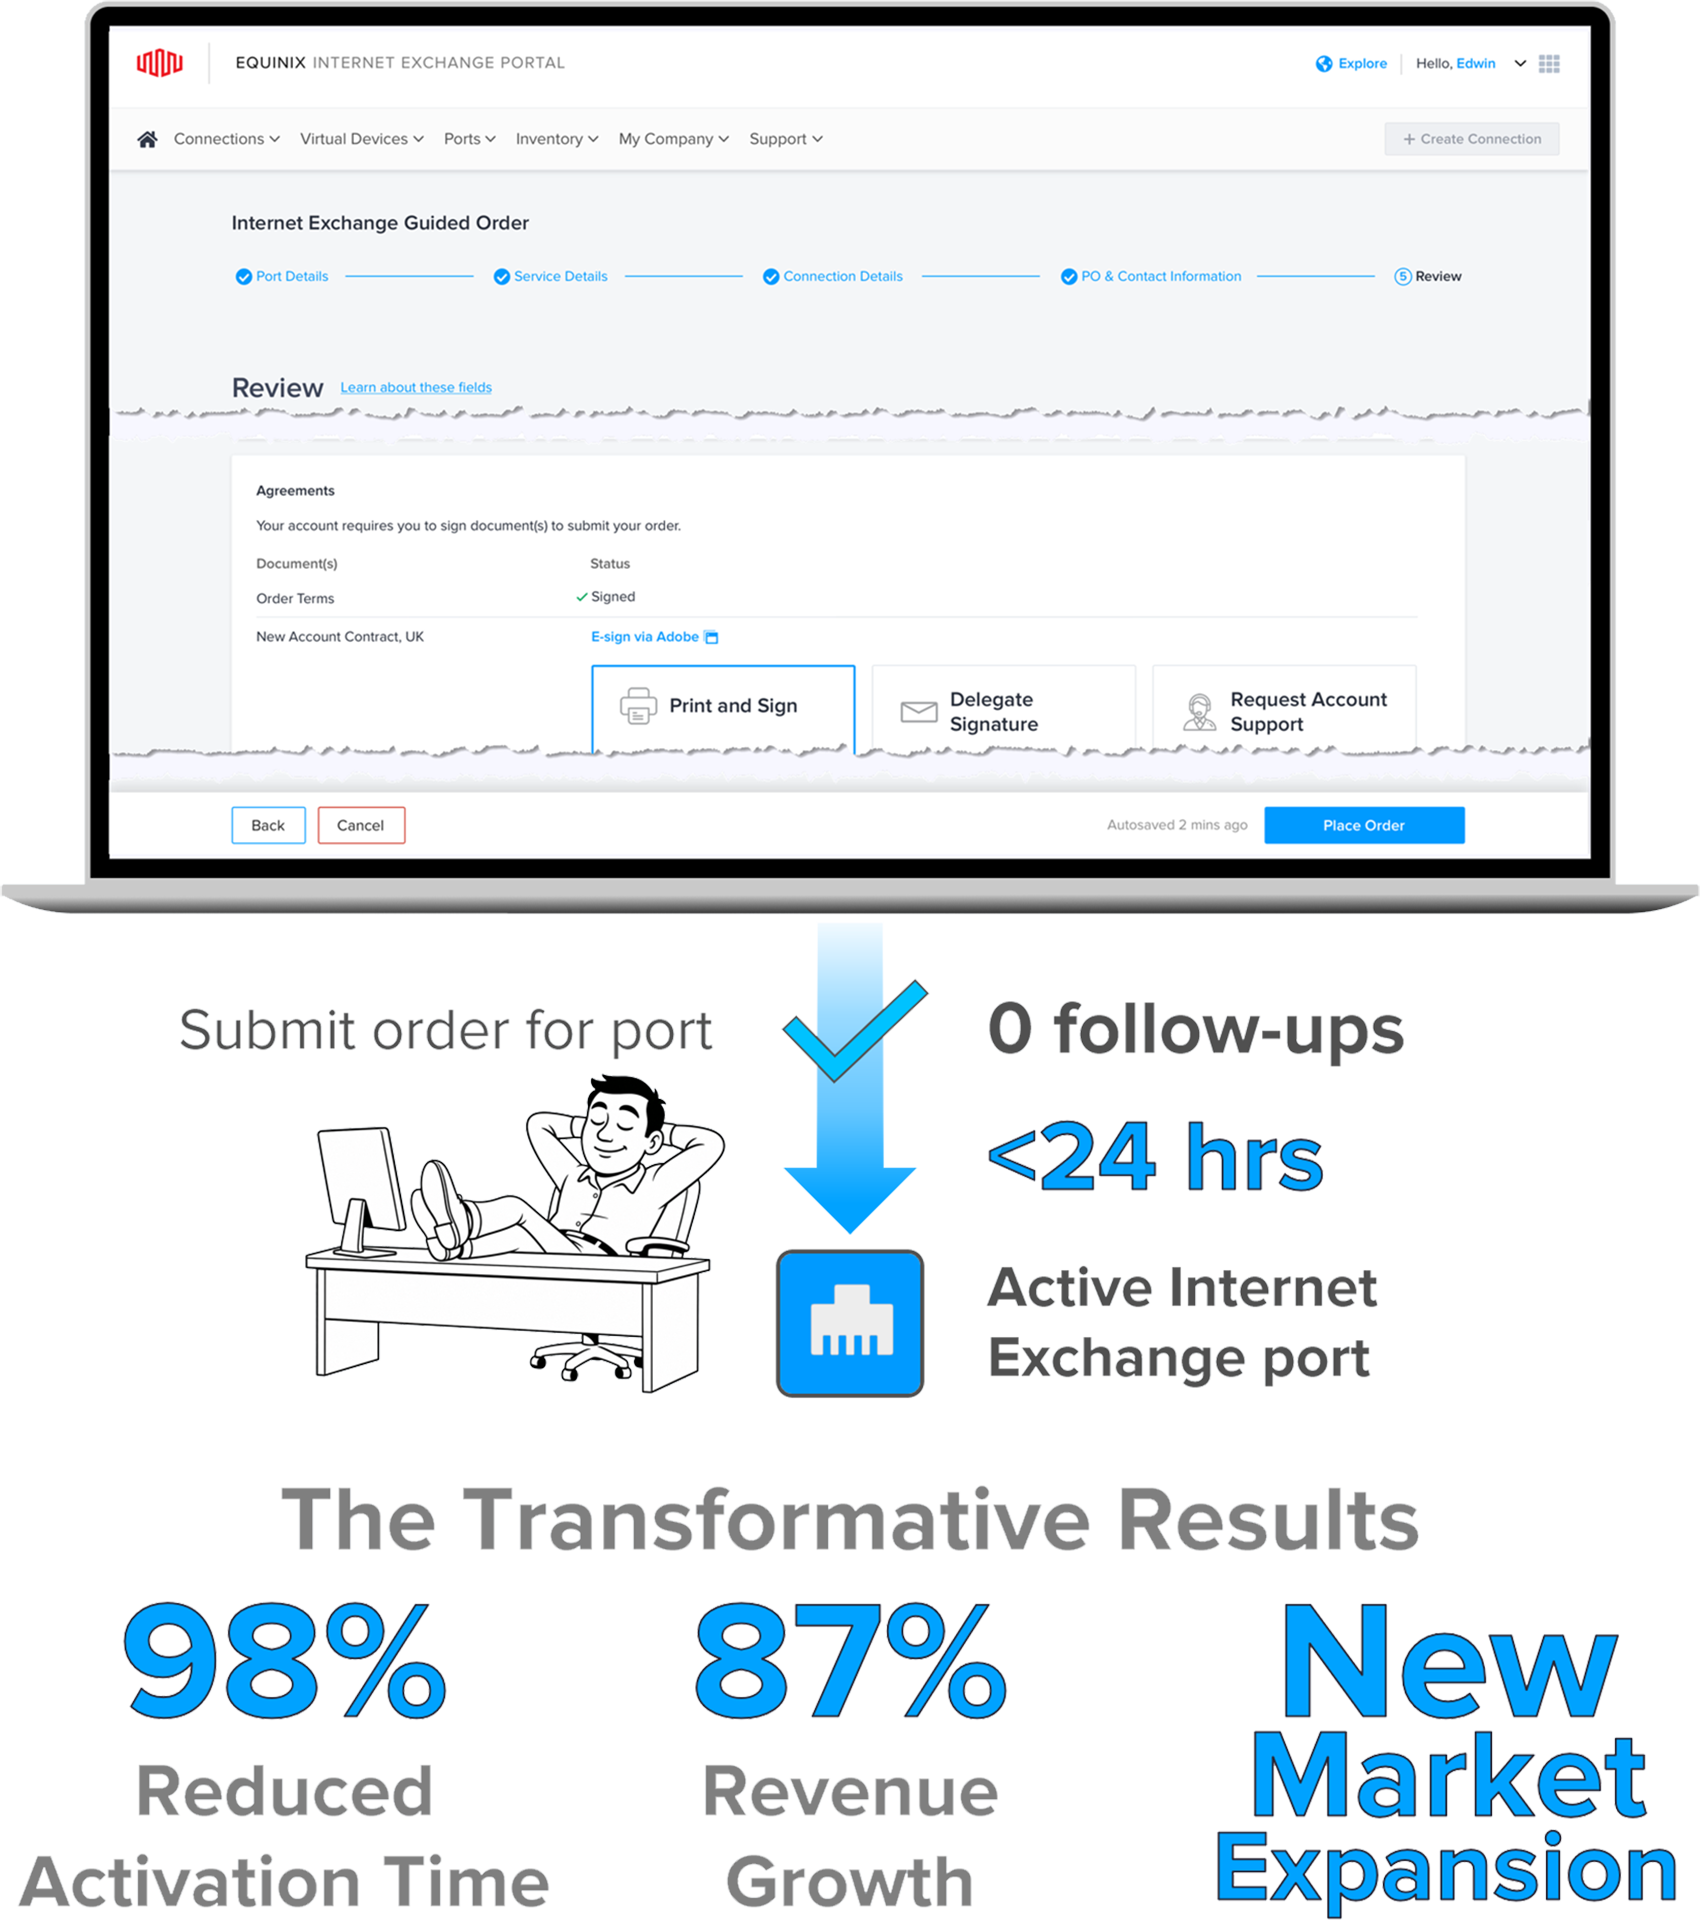
45 days ➔ <1 day, +87% revenue
Company: Equinix
PROJECT SUMMARY
Equinix's 45-day port activation time made us uncompetitive. From research to launch, I led the UX transformation that reduced it 98% to <1 day, growing revenue 87%, and opening our market beyond enterprise to new SMB customers.
RESPONSIBILITIES: END-TO-END UX
- Sole Experience Designer
- Quantitative research
- UX & Product Strategy
- Prototypes & UX specifications
- Pixel-perfect designs
TIMELINE & TEAM
6 months, with a Product Owner, Technical Product Manager, Engineering, & external visual designer
RESULTS
- 98% reduction in delivery time
- 87% revenue growth → $21.7M/mo
- Opened market to SMBs
From 45 days ➔ <1 day: A Process Transformed!
COMPANY & PRODUCT OVERVIEW
Equinix is the largest global data center provider, and Internet Exchange is the world's largest peering platform, where networks rent physical ports to exchange traffic directly ➔ faster speeds, lower costs vs third-party routing.

- 190+ data centers
- 70+ countries
Internet Exchange

Direct Connection
- Cheaper
- Faster
- Lower latency
PROCESS & TIMELINE
In 6 months, I ramped up on IX, worked with our PO and TPM to reframe our strategy, used that new strategy in designing a new ordering process, and shepherded that design to production with our Singapore engineers.

Discovery & Research with stakeholders & peer products
Recruited from 3 yrs on Cloud Exchange—2 as its sole designer + 1 mentoring its new designer

Reframe Product Strategy & set design strategy
Experience Design for expanded user set & comprehensive coverage

Collaborating to implement with remote devs

A process map shows steps; it doesn't show what a process assumes.
UX asking why...
DISCOVERY
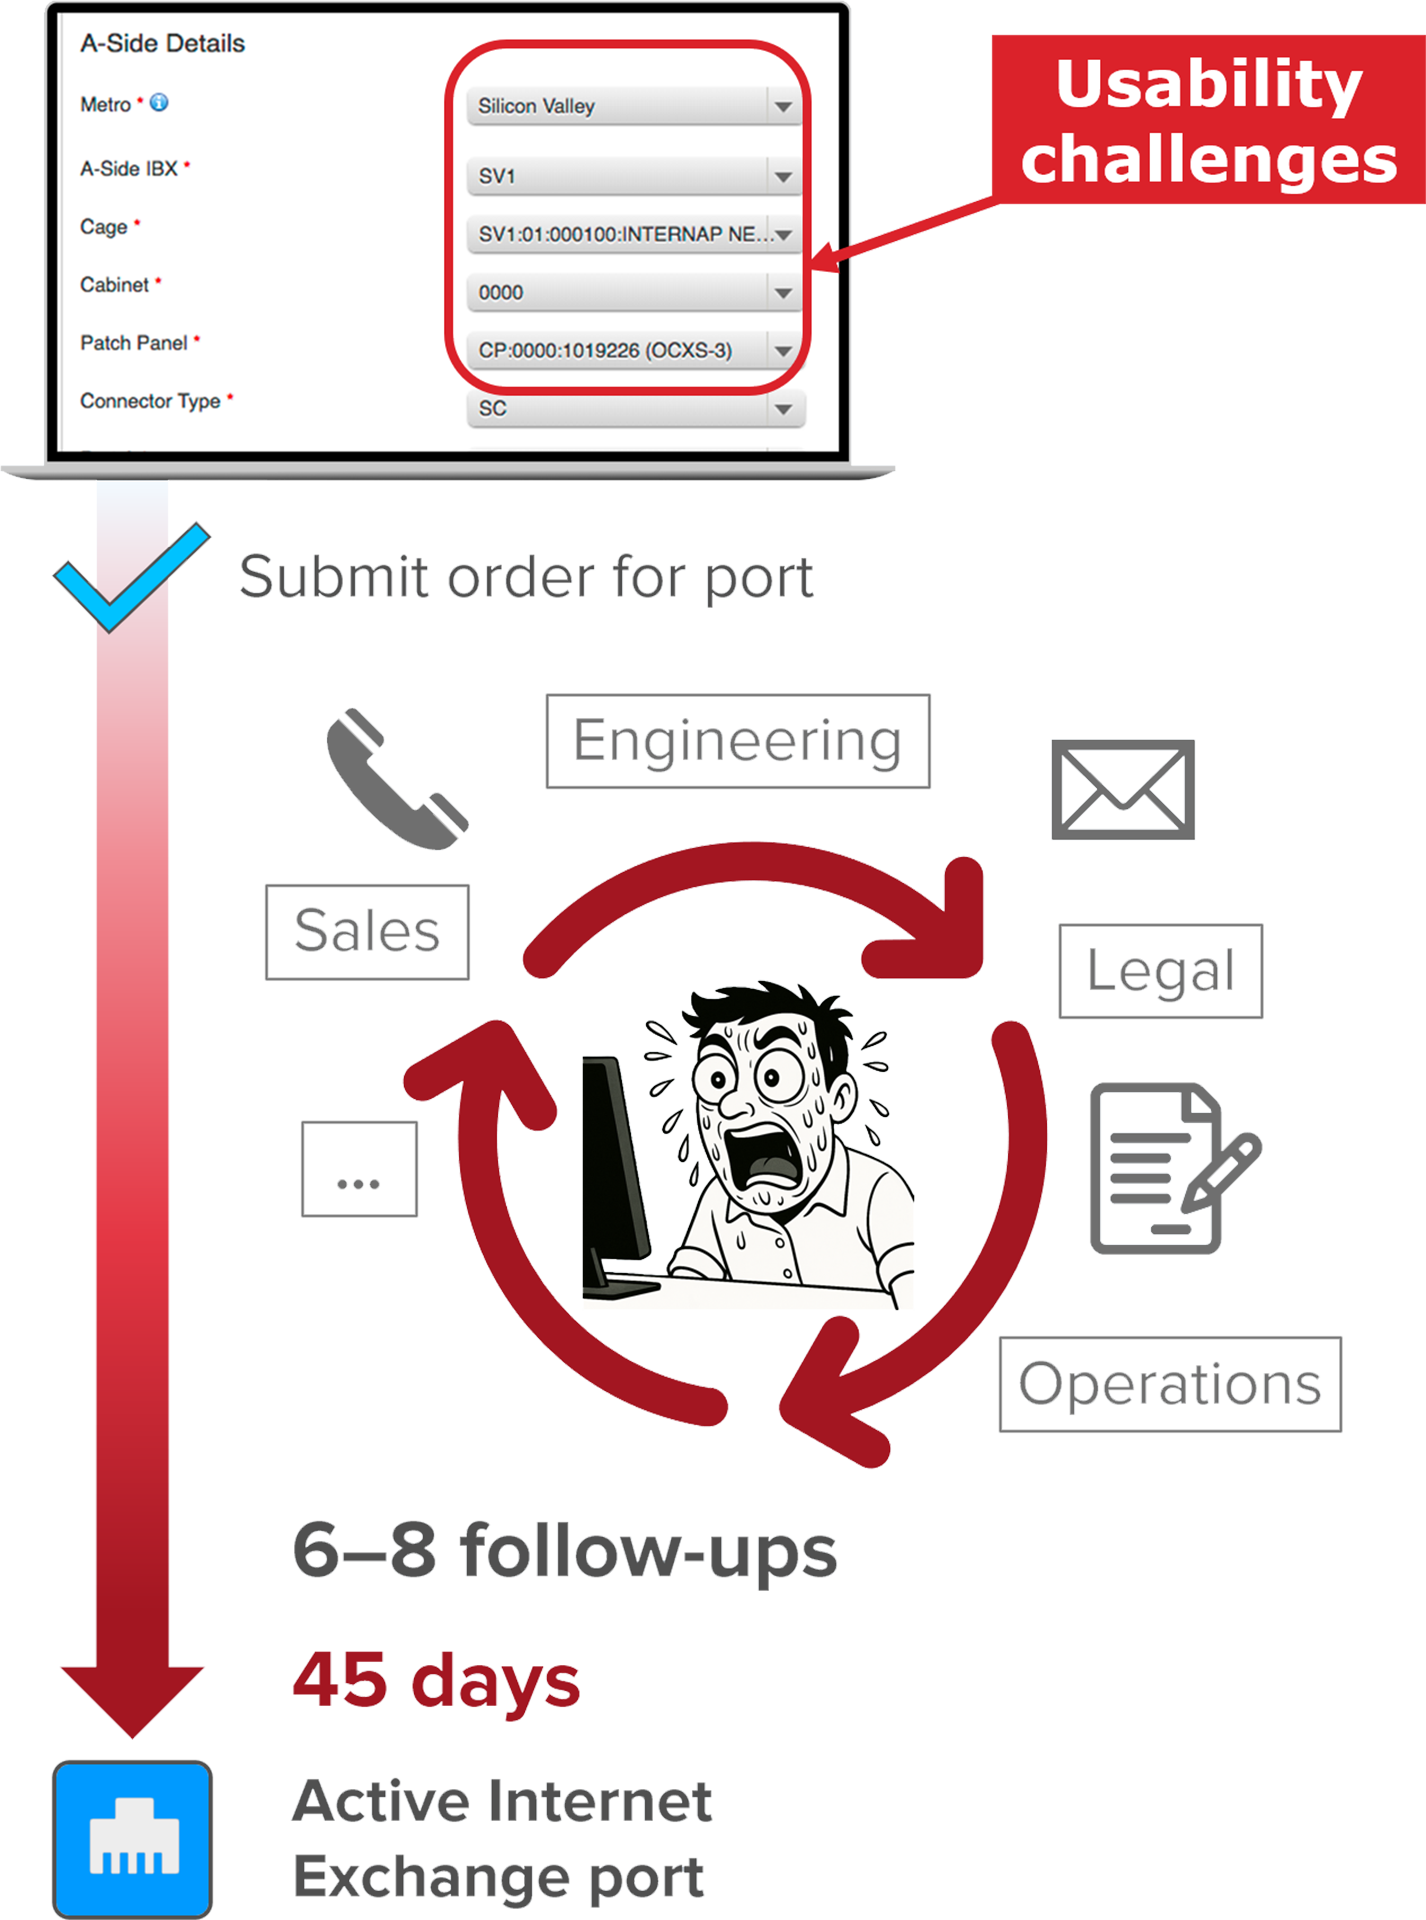
Working from our TPM's process map, I traced our 45-day average to our enterprise, white-glove mindset—a process that assumed every customer had an organization deep enough to absorb 6–8 rounds of follow-up and negotiation.

Quickly learned about IX product and the existing ordering and delivery process

Key finding: The order form, with its usability challenges, was just the start—every department followed up separately, each needing something from the customer

It added up: Each follow-up cost days or weeks on both sides

Core opportunity: Collect a complete order up front, not just a starting point
RESEARCH --> STRATEGIC SHIFT
Comparing our process with three competitors' processes, I realized that the speed gap was really a customer gap: they were built for buyers who wanted a transaction. So matching them meant expanding our market to SMB customers.

Competitors: less technical users

I realized competitors' designs focused on SMB and reframed our goal to "add SMB."

3 design imperatives: Clear pricing, educational content & industry-standard language, & 0 follow-ups
DESIGN STRATEGY
I set three design goals: make configuration effects visible (not hidden in dropdowns), support less technical users with in-context help, and integrate all workflows—from new country accounts to document signing—into one comprehensive wizard.

Visibility of logic, pricing, & process

Education for less technical buyers

Comprehensiveness: Integrate all ordering scenarios (including edge cases) into wizard—no post-order follow-ups
Build the structure of the task into the structure of the tool.
after Ed Hutchins' Distributed Cognition
SOLUTION: VISIBILITY & STRUCTURE
I transformed the business process map into a 5-stage wizard using tile-based selections—where configuration choices visibly affected downstream options, with pricing transparent from page one.

Show the 5 stages in a persistent step indicator

Progressive visibility + help: Selecting a tile reveals the next question and its options; help links embedded with the questions

Show real-time price as customer builds order using a persistent order summary
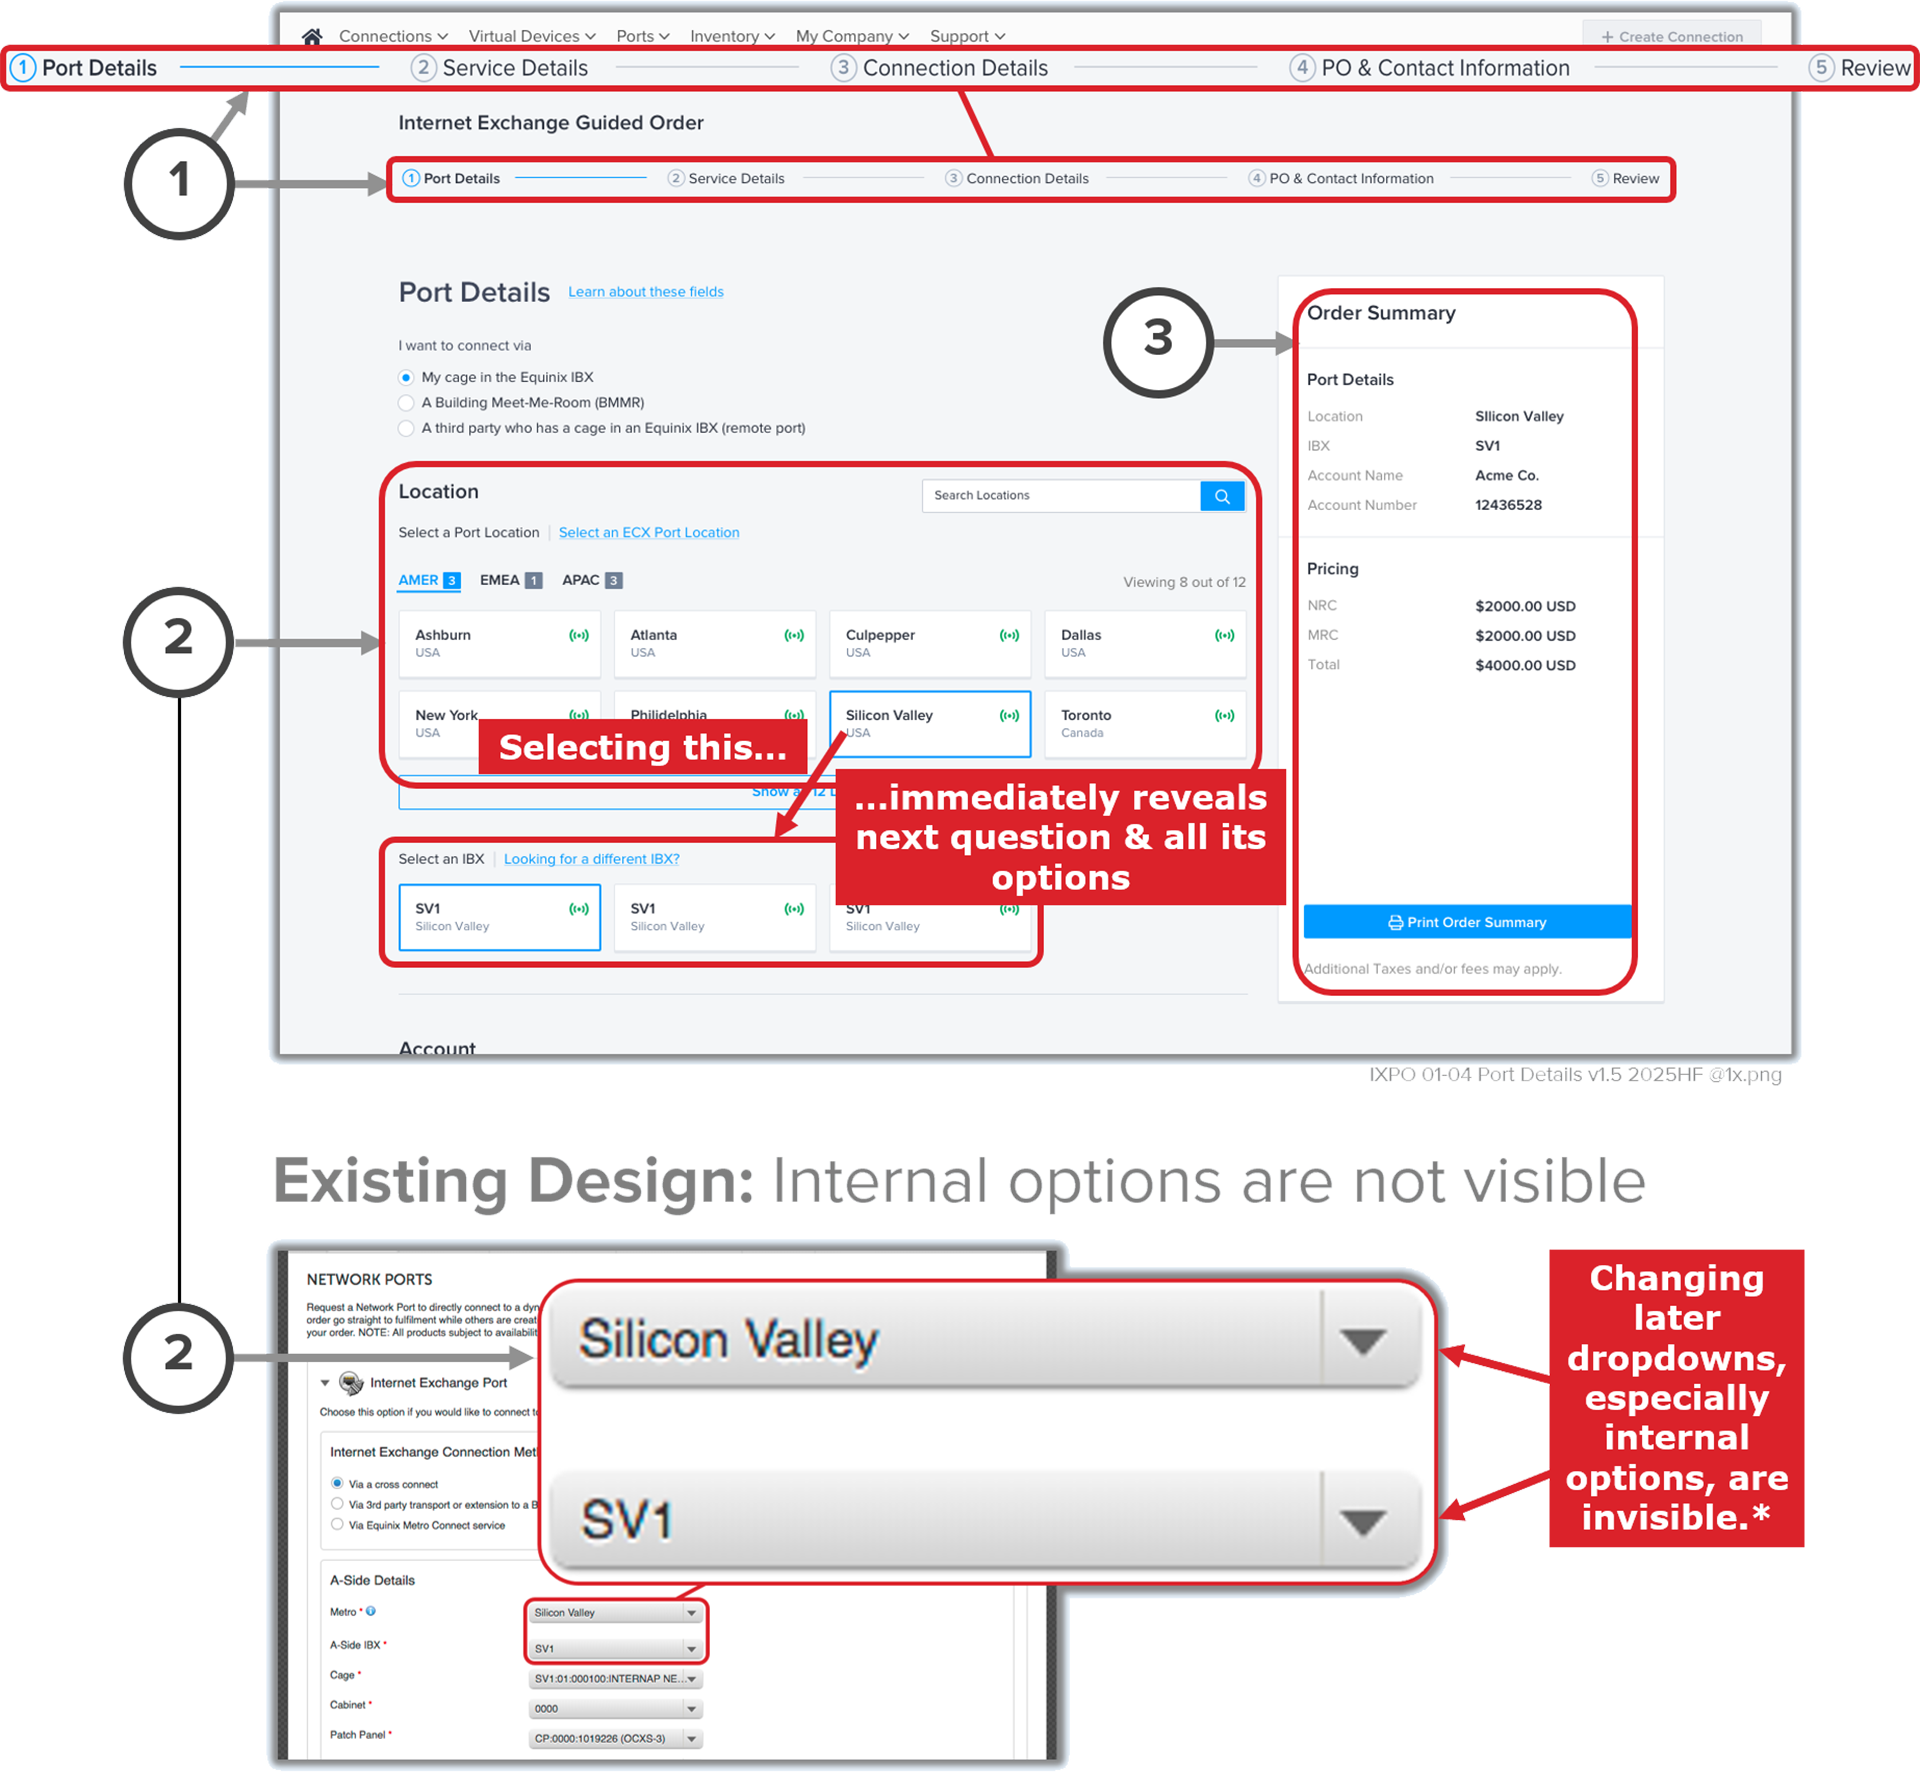
* 2cm foveal attention + heuristics from Don Norman, Jakob Nielsen, and Ben Shneiderman + distributed cognition (Ed Hutchins)
SOLUTION: COMPREHENSIVENESS
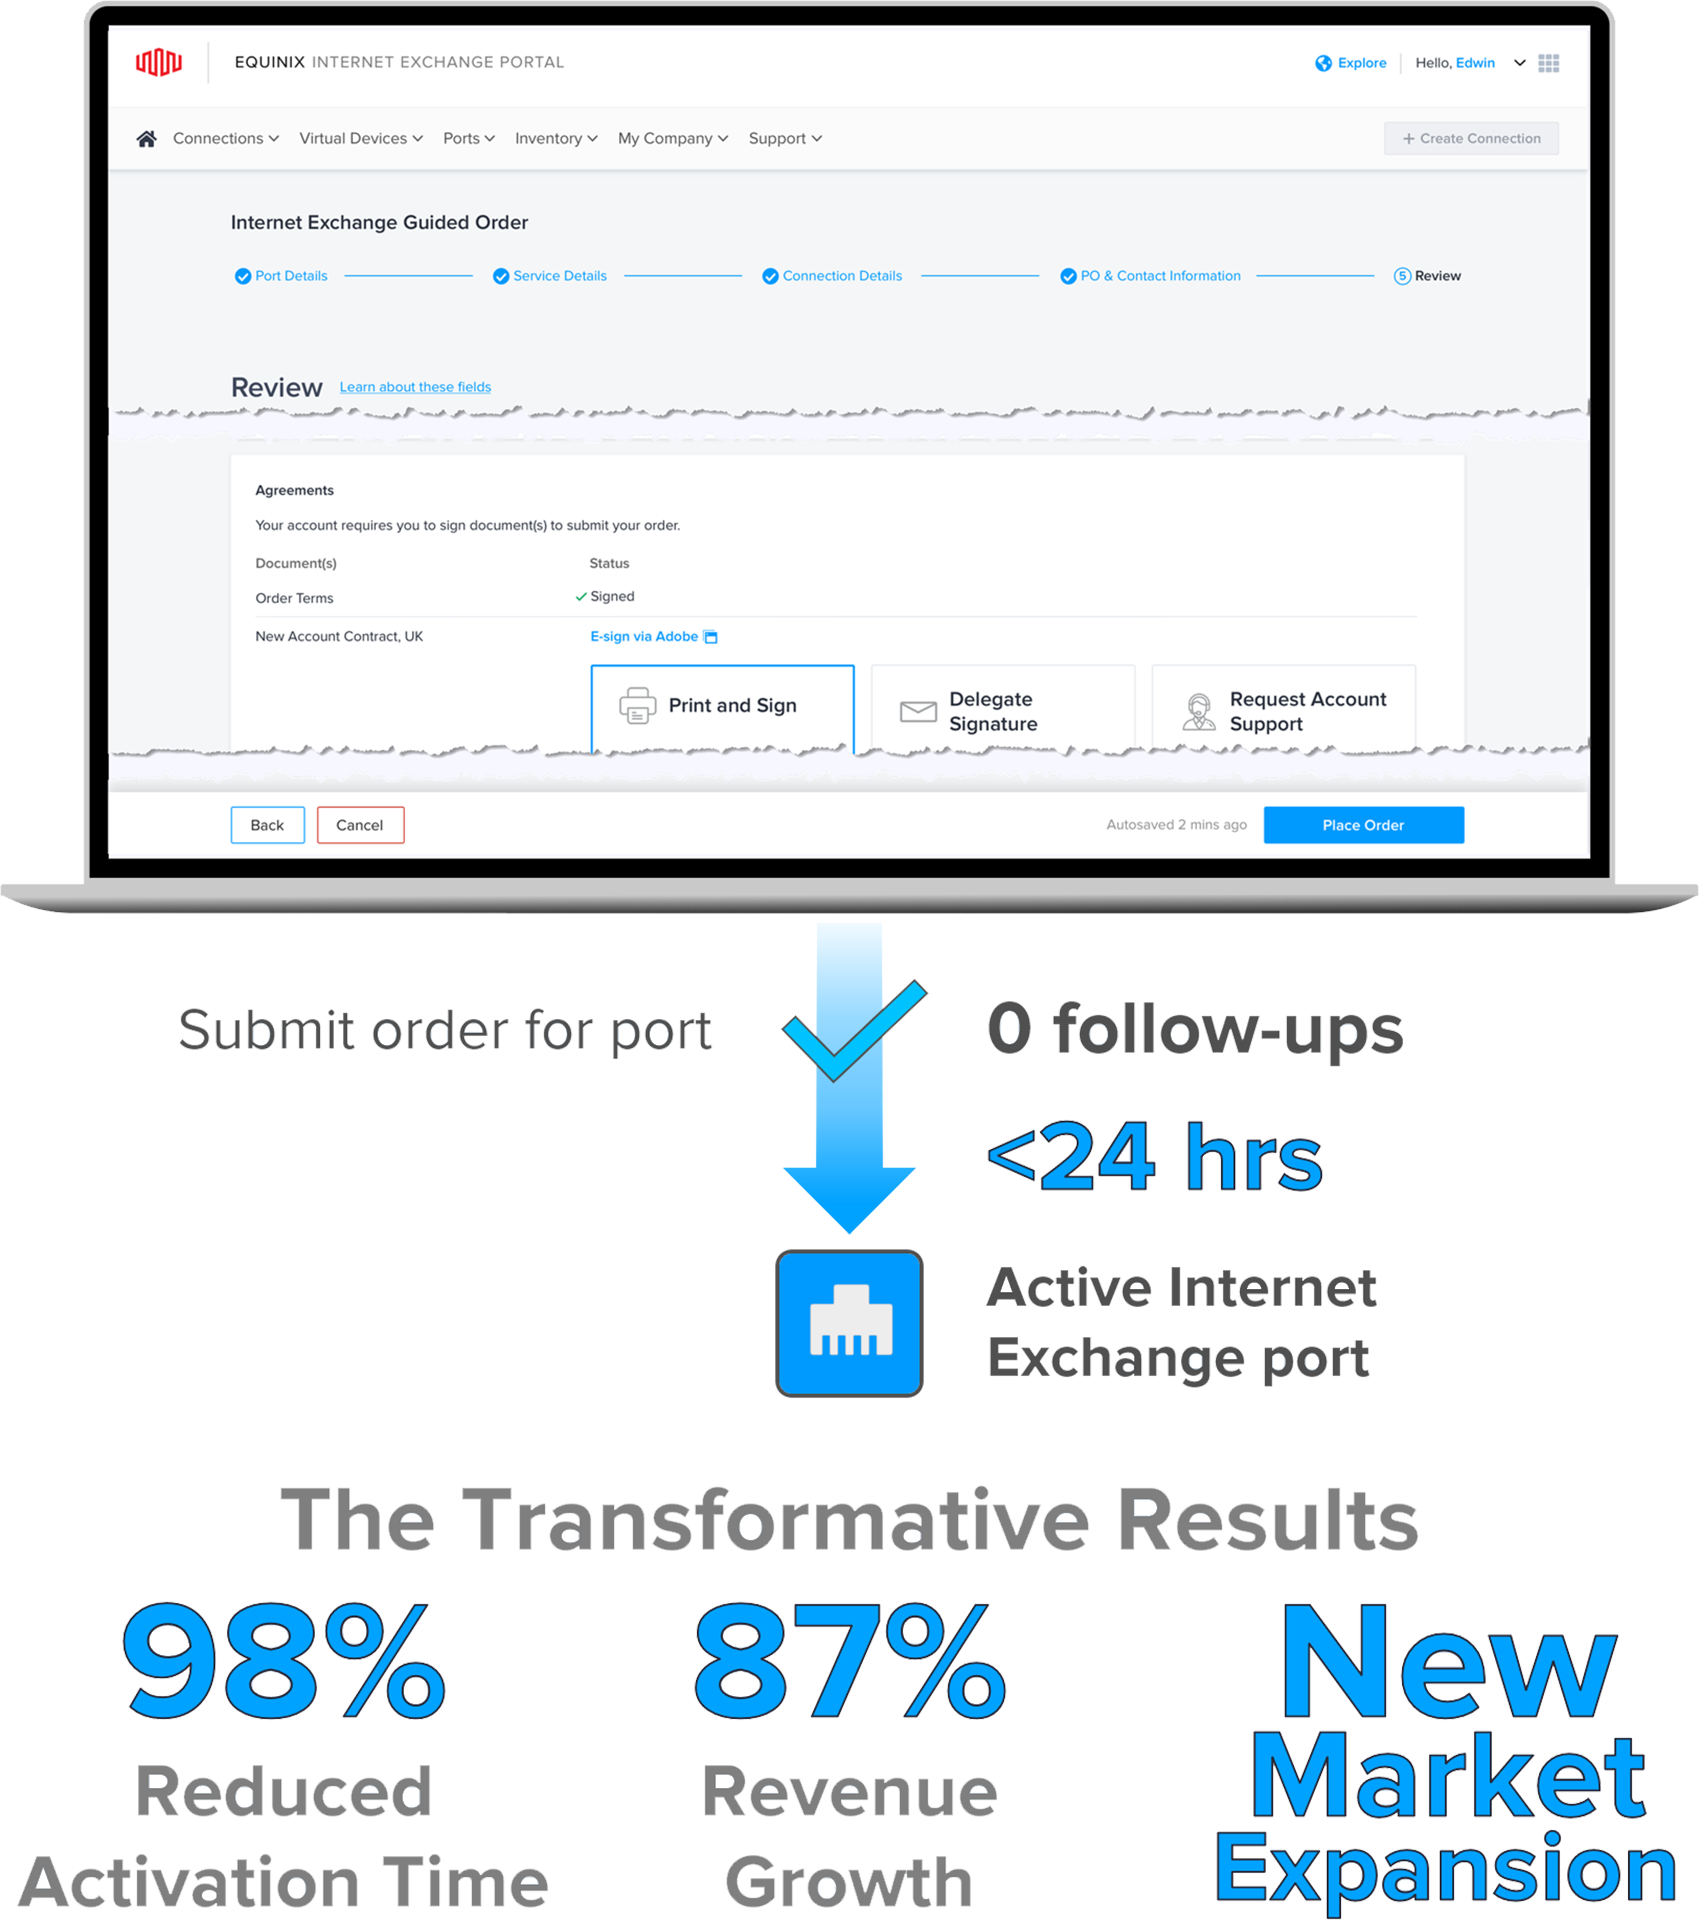
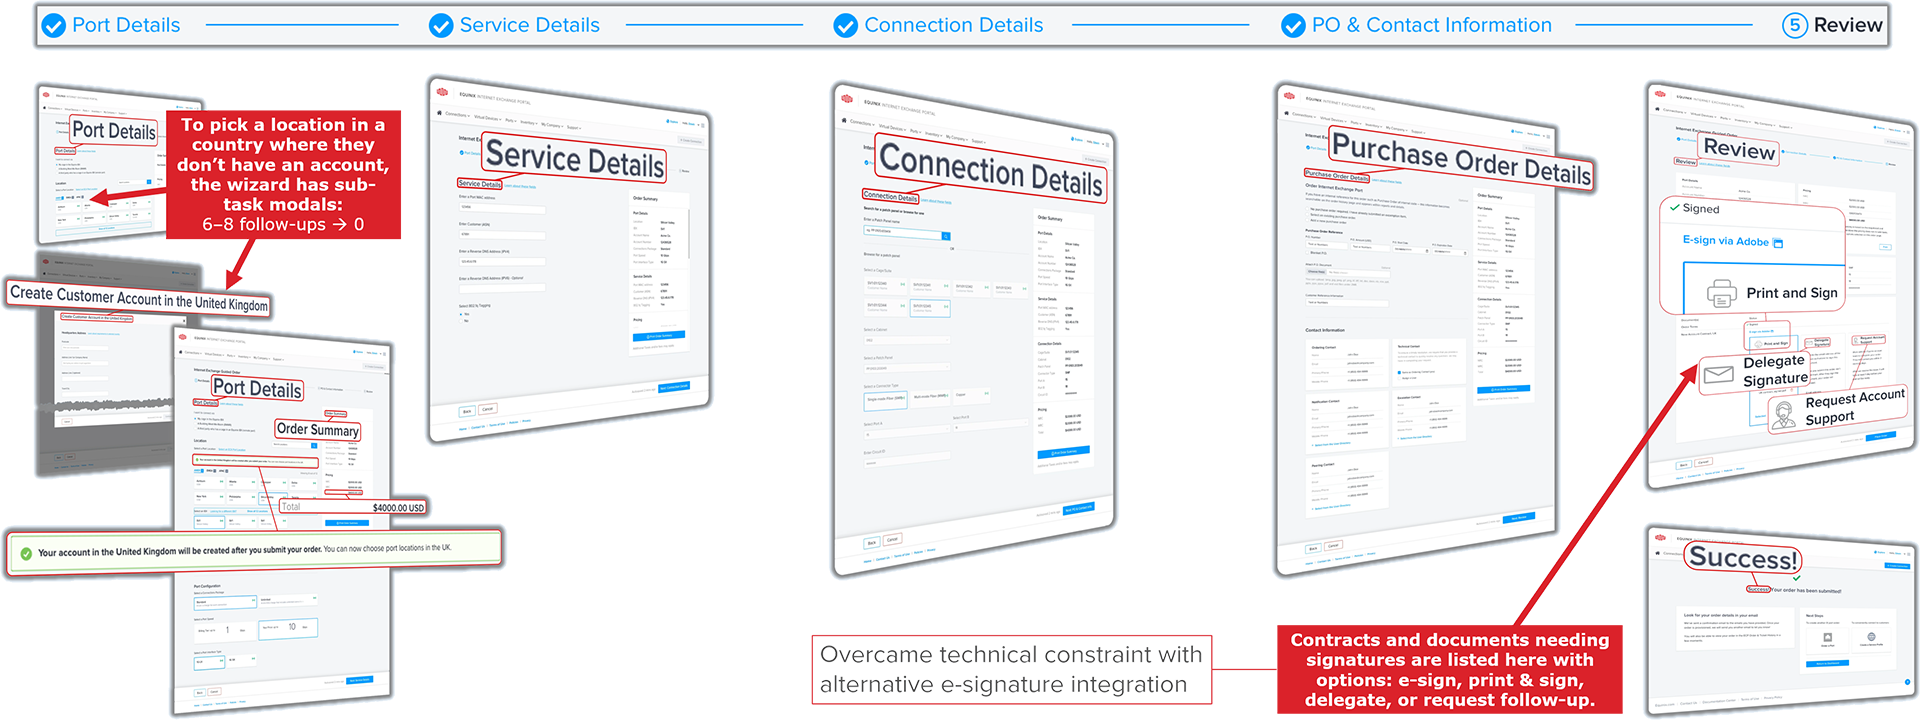
I integrated all special case workflows—new country account setup, document signing through our e-signature vendor—as embedded sub-tasks, eliminating the typical 6–8 departmental follow-ups by collecting everything in the wizard.
COMPONENT DESIGN → DESIGN SYSTEM
I carried the whys I'd inferred down into the components: tiles support comparison, prices stay visible, a confirmation page because SMB buyers wanted a transaction. Adopted by every IaaS product via our design system: the needs turned out to be everyone's.
Aded tile variants to enable at-a-glance comparison
Added new components: Order summary, document signing tiles, order confirmation page, enhanced step indicator for multi-page wizards
Design system work: Reconciled two nascent design systems; documented patterns with both teams—which led to my next project, consolidating port ordering across products
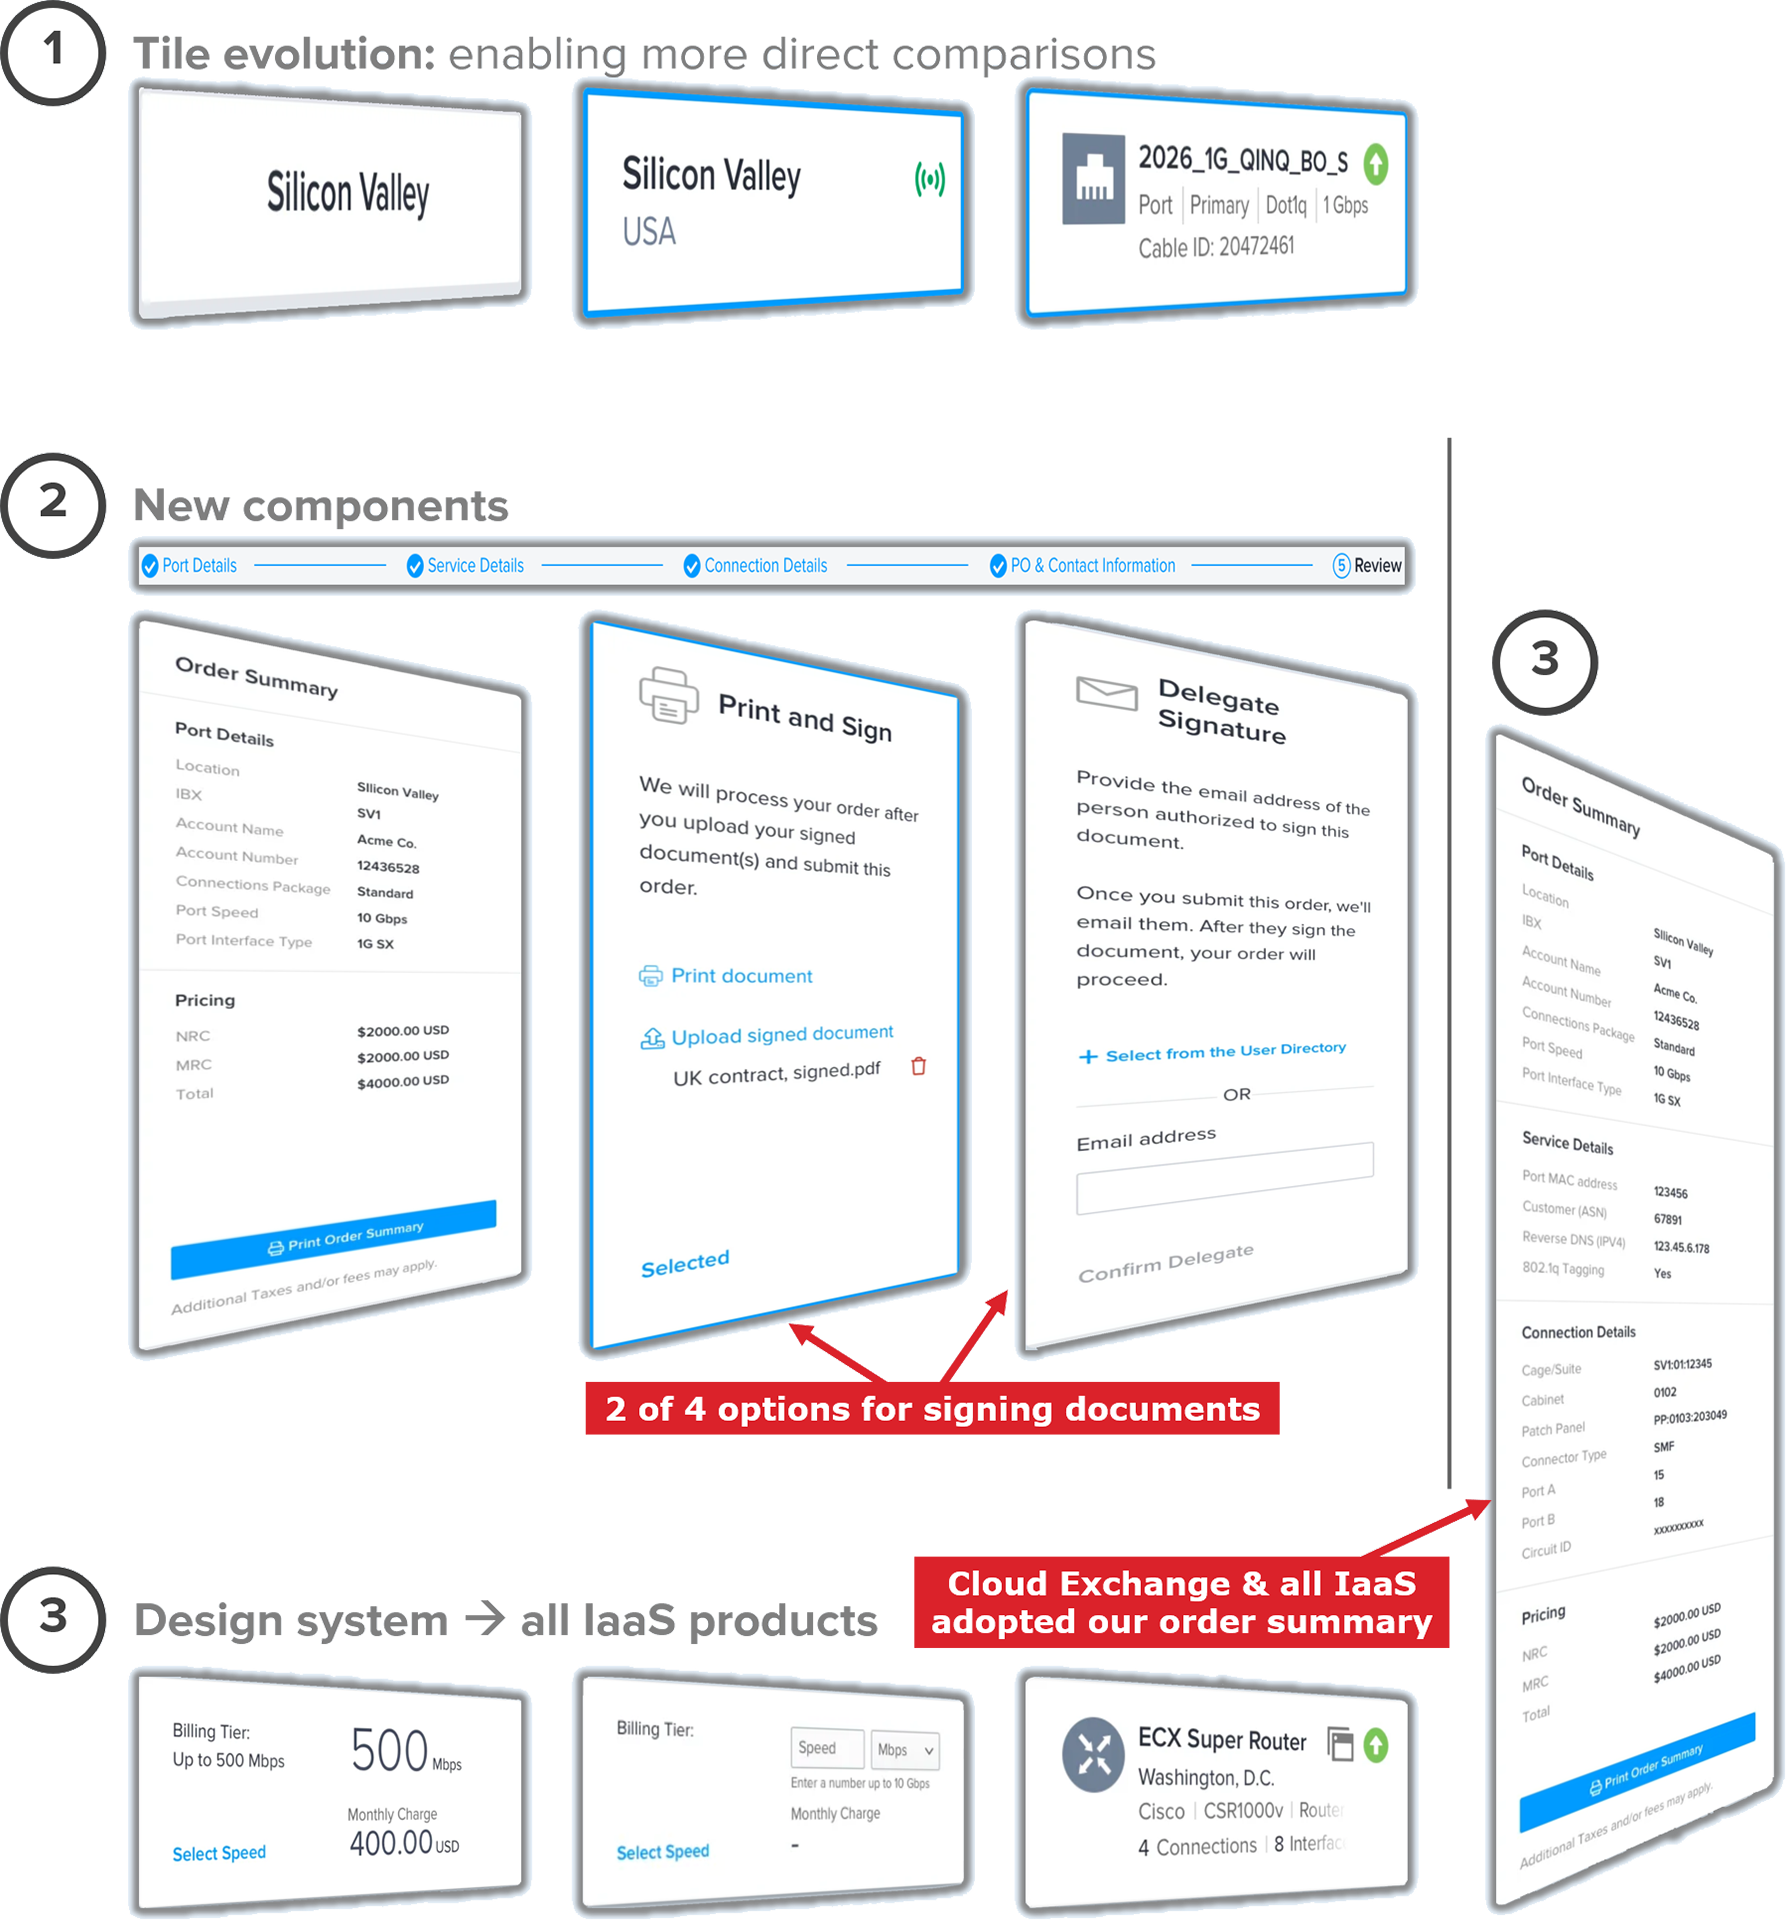
The structure of the order used to be assembled through follow-ups and negotiations. I built it into the structure of the wizard.
BUSINESS RESULTS
An early customer got their port in less than 24 hours—98% faster. Revenue went up 87%, port sales by 73%. More confident customers bought both more ports and more expensive ones.
"The UI/UX and order flow actually worked great... we went from 'wouldn't it be convenient?' to activation in <24 hours.”
—Customer email, shared by our Product Owner
STRATEGIC IMPACT & LESSONS
We added SMB customers to IX’s target market through research-driven design—a strategic win beyond our 2-day goal. Next time, I'd advocate for UX involvement earlier in process mapping and Engineering discussions.

Transparency & Education Opened Market to SMBs

Foundation for future: Components added to Infrastructure as a Service (IaaS) design system ➔ all IaaS products

Lesson: Include UX in process mapping and earlier Engineering discussions
SUMMARY
98% faster activation. 87% revenue growth. Market expansion through research-driven design—a strategic win beyond our 2-day goal. Design system foundation.

Smashed original 2-day goal: The transformed 45-day high-touch process enabled a <24-hour comprehensive online experience

Strategic shift from 2-day goal to adding SMB customers: research-driven design led to expanded market, added revenue, and gave customers the confidence to buy more expensive ports

Scale of impact: Created the components and wizard template adopted by every IaaS product via our design system
"Thanks for all your efforts last year to make these flows so good they're changing perceptions of interacting with Equinix. This project is going to have a huge impact."

Product Owner, Greg Dendy
0.6.4+ wc, 10/28/2026
Selected Works